Every dashboard number has a long trip behind it. Let’s follow one row from a database to a dashboard, and see what can go wrong on the way.
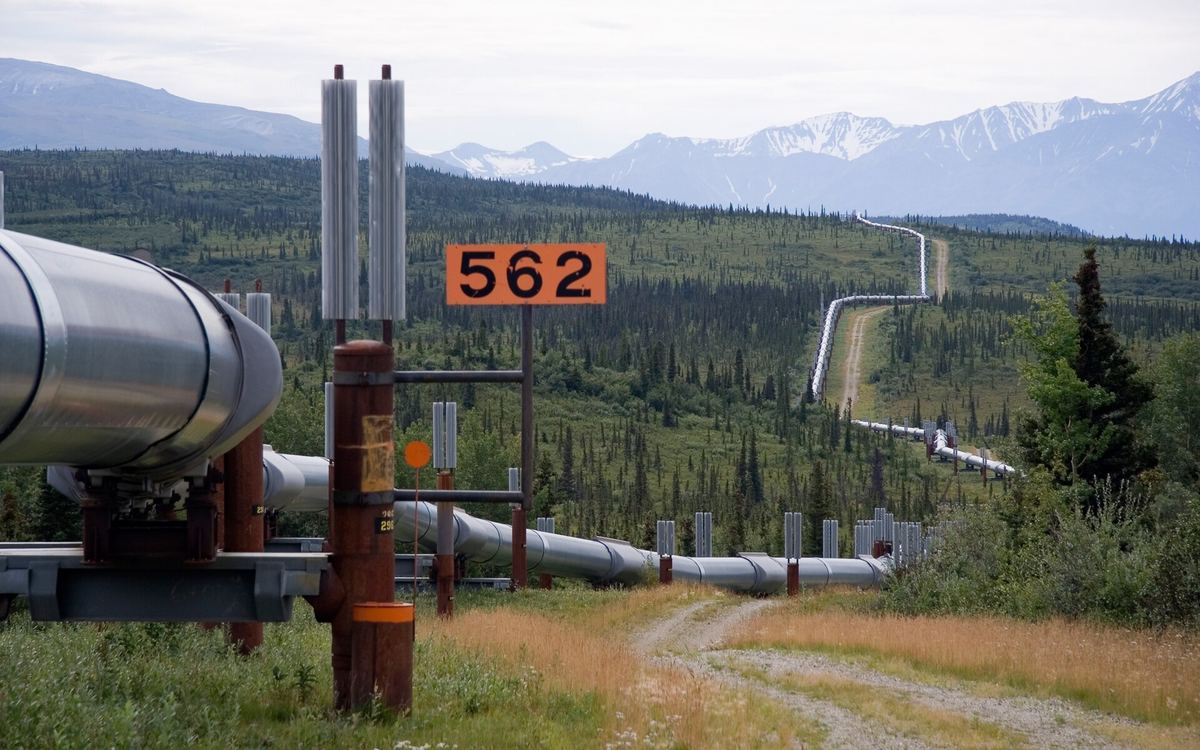
Cover: the Trans-Alaska Pipeline System, photo by Luca Galuzzi, CC BY-SA 2.5.
A data pipeline is usually drawn as three boxes and two arrows: extract → transform → load. The drawing is accurate, but it hides almost everything that matters. The hard parts of a pipeline sit in the arrows. Most of the work is moving data between systems that fail independently, disagree about time, and change their shape without asking.
Here is the whole path, with the parts the three-box drawing leaves out:
 source DB ──► capture ──► log (Kafka) ──► stage 1 ──► stage 2 ──► ... ──► sink
     │            │             │              │                           │
  changes     CDC / poll   partitions,     transform,                 warehouse,
  happen                   offsets,        validate,                  lake, index,
                           retention       enrich                     API cache
                                  ▲
                                  └── orchestrator: schedules, retries, backfills
1. Capture: how do you know something changed?
There are two ways to get data out of a source system, and choosing between them sets everything that follows.
Polling (batch extraction). Every N minutes, run SELECT * FROM orders WHERE updated_at > :last_run. It’s simple, and it quietly loses data in three ways:
- Deletes don’t have an
updated_at. A deleted row simply stops appearing, and the pipeline never finds out. - Clocks and transactions disagree. A transaction that started before your cursor but committed after it has an
updated_atyou have already passed. You skip it forever. - Intermediate states vanish. If a row goes
pending → paid → refundedbetween two polls, you only ever seerefunded.
Change Data Capture (CDC). Instead of asking the table, read the database’s own write-ahead log (the Postgres WAL, the MySQL binlog, a MongoDB change stream). Every insert, update and delete arrives in commit order, with the before and after images. Tools like Debezium do this and publish each change as an event.
CDC fixes all three problems because it reads what the database did, not what it currently looks like. The cost is operational: you now depend on log retention, replication slots, and schema changes flowing through a system that was never designed to be an API.
A useful rule: poll when you want a snapshot, use CDC when you want history.
2. The log: why almost every pipeline has a Kafka in the middle
Once changes are captured, they need somewhere to land that is durable, ordered and replayable. That is what a log like Apache Kafka provides, and it is worth understanding why it is shaped the way it is.
A Kafka topic is split into partitions. Each partition is an append-only file. Every message gets a monotonically increasing offset within its partition.
topic: orders
  partition 0: [0][1][2][3][4][5][6] ...
  partition 1: [0][1][2][3] ...
  partition 2: [0][1][2][3][4] ...
Three properties follow from this, and pipelines depend on all of them:
- Ordering is per partition, not per topic. If every event for
order_id=42must be processed in order, all of them must land in the same partition. That’s what the message key is for:partition = hash(key) % num_partitions. Choose the key badly and you get either lost ordering or one “hot” partition doing all the work. - Consumers track their own position. The log doesn’t delete a message when someone reads it. Each consumer group commits the offset it has reached. Two teams can read the same topic at different speeds, and a new team can start from the beginning.
- Replay is free. If a bug corrupted yesterday’s output, you reset the consumer group’s offset and reprocess. This one property is the reason logs replaced queues in most data platforms.
Parallelism comes from partitions: a consumer group can have at most one active consumer per partition. Twelve partitions means you can scale a stage to twelve workers, and never more without repartitioning.
3. Delivery semantics: “exactly once” is a property of the whole system
Every distributed pipeline has to answer one question: what happens if a worker crashes halfway through a message?
Consider a consumer that reads a message, writes the result to a database, then commits the offset:
for msg in consumer:
    result = transform(msg.value)
    db.write(result)          # (1)
    consumer.commit(msg)      # (2)
- Crash between (1) and (2): on restart the message is read again and written twice. This is at-least-once.
- Swap the order, committing before writing, and a crash loses the message. That’s at-most-once.
Real “exactly once” delivery across two independent systems doesn’t exist, because the offset commit and the database write can’t be one atomic step. What you can build is effectively once: at-least-once delivery plus an idempotent sink, so that processing a message twice has the same effect as processing it once.
for msg in consumer:
    result = transform(msg.value)
    # The key makes the write idempotent: a replay overwrites, it doesn't duplicate.
    db.upsert(key=(msg.topic, msg.partition, msg.offset), value=result)
    consumer.commit(msg)
Other ways to get idempotency:
- Natural keys. Upsert on
order_idplus a version number, and ignore anything older than what’s stored. - Transactional outbox. Store the offset in the same database transaction as the result. On restart, read the offset from the database, not from Kafka.
- Kafka transactions. When both input and output are Kafka topics, the producer can commit the output messages and the input offsets atomically. This is what Kafka Streams and Flink mean by exactly-once.
Most duplicate-data bugs I’ve seen came from someone assuming “exactly once” was a checkbox, when it’s really a design property of the sink.
4. Transform: stages, and why they should be small
A transform stage reads from one place, does one kind of work, and writes somewhere else. Typical stages:
- Validate: reject records that break the contract (missing keys, wrong types, impossible values).
- Normalize: unify units, timezones, encodings and IDs across sources.
- Enrich: join with reference data, such as a customer’s region or a product’s category.
- Aggregate: roll events up into windows (“orders per minute per region”).
The temptation is to do all of this in one big job. Resist it. Separate stages with a durable handoff between them (a topic, or a table partition) give you:
- Isolation of failure. If enrichment breaks, validation keeps running and data queues up instead of disappearing.
- Independent scaling. The expensive join gets 20 workers; the cheap validation gets 2.
- Inspectable intermediate state. When a number looks wrong, you can check every hop and find where it went wrong.
Bad records: the dead-letter queue
A single malformed record should never stop a pipeline. The standard pattern is a dead-letter queue (DLQ): records that fail validation, or fail processing after N retries, go to a side topic along with the error and the original payload. The main flow continues.
try:
    out.send(transform(msg.value))
except ValidationError as e:
    dlq.send({"error": str(e), "source": msg.topic, "offset": msg.offset, "payload": msg.value})
The DLQ only works if someone looks at it. Alert on its rate, not on its existence.
5. Schemas: the contract nobody wrote down
Pipelines break more often from shape changes than from crashes. An upstream team renames amount to amount_cents, and every downstream sum is suddenly 100× wrong, silently.
Two defenses:
- A schema registry. Producers register a schema (Avro, Protobuf or JSON Schema) for every topic, and each message carries a schema ID. The registry enforces a compatibility mode: backward-compatible changes (adding an optional field with a default) are allowed, and breaking changes (removing or renaming a field, changing a type) are rejected at publish time, before they reach anyone.
- Contract tests at the boundary. Validate on ingest, and fail loudly into the DLQ rather than coercing quietly.
Treat a topic’s schema like a public API, because it is one.
6. Time: event time vs processing time
Every record has at least two timestamps:
- Event time: when it actually happened (the user clicked at 10:59:58).
- Processing time: when your pipeline saw it (09:14 the next morning, because the phone was offline).
If you aggregate by processing time, your “orders per hour” chart depends on network weather. If you aggregate by event time, you have to answer a harder question: when is an hour finished?
Stream processors answer it with a watermark, a moving assertion that says “I believe I’ve now seen all events up to time T”. A window closes when the watermark passes its end. Events that arrive after that are late, and you choose a policy:
- drop them (and count them, so you know how many),
- allow a grace period and re-emit corrected results, or
- send them to a side output for a later batch correction.
There’s no free answer. You’re trading latency (waiting longer) against completeness (being right).
7. Backpressure: when a downstream stage is slower
If stage 2 processes 1,000 records a second and stage 1 produces 5,000, something has to give. In a push-based system it’s memory, and the process dies. A log-based design handles this well, because consumers pull. A slow stage simply falls behind, and the gap shows up as consumer lag: the distance between the newest offset in a partition and the offset the group has committed.
Lag is the single most important number in a streaming pipeline. Rising lag means you are under-provisioned or something downstream is degrading. Lag that is flat but non-zero is fine. Lag growing faster than retention will eventually mean data loss, because Kafka deletes old segments whether or not you’ve read them.
8. Orchestration: the part that runs the parts
Stages that run continuously are one half of a pipeline. The other half is batch work with dependencies: “rebuild the daily revenue table after the orders load and the currency-rates load have both finished”. That’s a DAG, and running DAGs is the orchestrator’s job (Airflow, Dagster, Argo, or something built in-house).
A good orchestrator gives you:
- Dependency resolution. A task runs only when its upstreams have succeeded.
- Retries with backoff. Many failures are transient: a timeout, a throttled API, a node that got evicted. Retry them automatically, and give up after N tries.
- Idempotent tasks. A retried task must be safe to run twice. The easy way is to have every task overwrite a partition (
date=2026-09-26) rather than append to a table. - Backfills. “Re-run this DAG for every day in March” should be one command. It only works if tasks are parameterized by the date they process, not by
now(). - Visibility into long-running jobs. Status, duration, and notifications when a job fails, stalls, or finishes. A job that is silently stuck for six hours is worse than one that fails in six seconds.
The most important rule: a task should compute its output from its inputs and its parameters, never from the wall clock. That single rule is what makes retries, backfills and reproducibility work.
9. Observability: is the data right, not just the servers
A pipeline can be green on every infrastructure dashboard and still be delivering wrong numbers. Monitor the data as well as the processes:
| Signal | Question it answers |
|---|---|
| Freshness | When did the newest record land in the sink? |
| Volume | Did today’s row count fall 40% below the usual Tuesday? |
| Lag | How far behind the source is each stage? |
| DLQ rate | What fraction of records are being rejected, and why? |
| Reconciliation | Does count(*) or sum(amount) at the sink match the source for the same window? |
Reconciliation is the one teams skip and later wish they hadn’t. A nightly job comparing source and sink totals per partition will catch the silent-drop bugs that no exception ever reports.
Putting it together
Go back to the three boxes and two arrows. A production pipeline is really:
- Capture that reads the source’s history, not just its current state.
- A durable, partitioned log so stages are decoupled and everything can be replayed.
- At-least-once delivery with idempotent sinks, which is the only honest way to get “exactly once”.
- Small stages, with a dead-letter queue instead of crashes.
- A schema contract, enforced before bad data is published.
- Event time and watermarks, with an explicit policy for late data.
- Lag as the main health metric, because pull-based consumers make backpressure visible.
- An orchestrator running idempotent, parameterized tasks that can be retried and backfilled.
- Data-level observability: freshness, volume, and reconciliation against the source.
None of these are exotic. Leave any one of them out, though, and the pipeline will eventually hand someone a wrong number with complete confidence. Most of data engineering is making sure that doesn’t happen.